Chart Cards
A chart card draws a line, bar or donut chart from rows of JSON. Juneau draws it as inline SVG with no third-party
chart library. The script is juneau-charts.js, and <@page> loads it for you when a page has a chart card.
A chart from an endpoint
<@card type="chart" id="orders-trend" title="Orders" src="/console/store/stats/daily">
{ kind: 'line', x: { field: 'day', label: 'Day' },
  series: [ { field: 'placed', label: 'Placed' }, { field: 'delivered', label: 'Delivered', tone: 'ok' } ] }
</@card>
The endpoint returns an array of flat rows, or an object with a rows array:
[ { "day": "Mon", "placed": 3, "delivered": 1 }, { "day": "Tue", "placed": 5, "delivered": 2 } ]
From Java, build the same card with ChartDef:
page.card(ChartDef.line("orders-trend").title("Orders").src("/console/store/stats/daily")
	.x("day", null, "Day")
	.series("placed", "Placed")
	.series("delivered", "Delivered", "ok")
	.toCardSpec());
Kinds
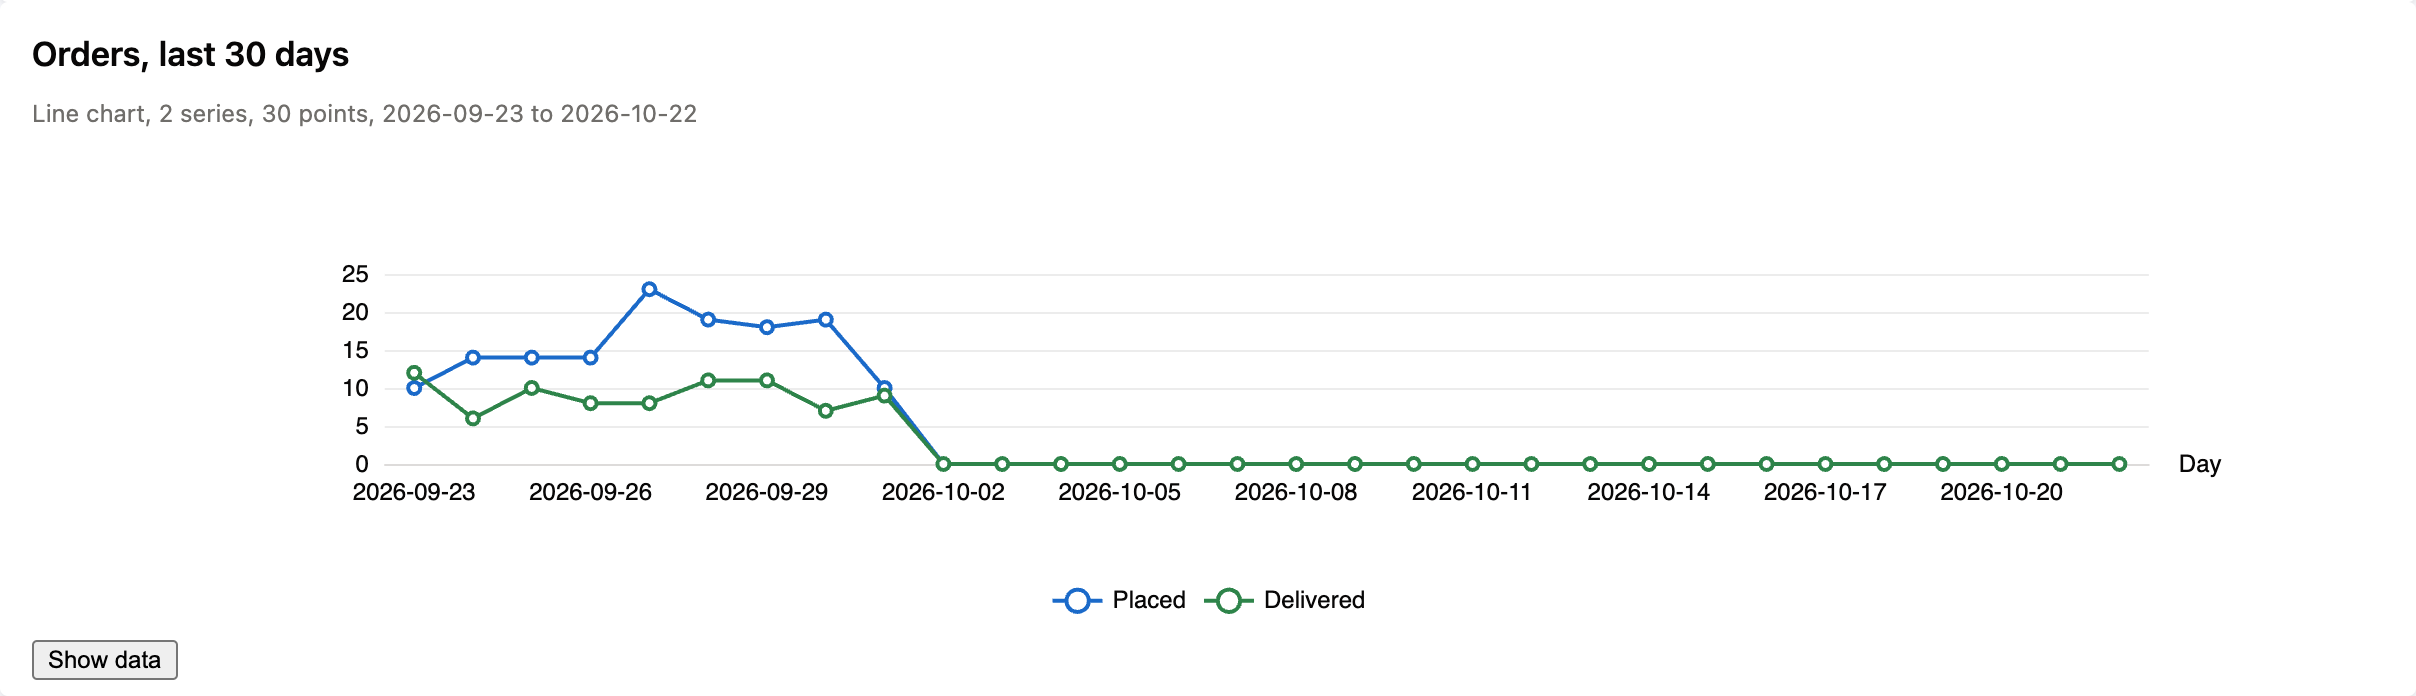
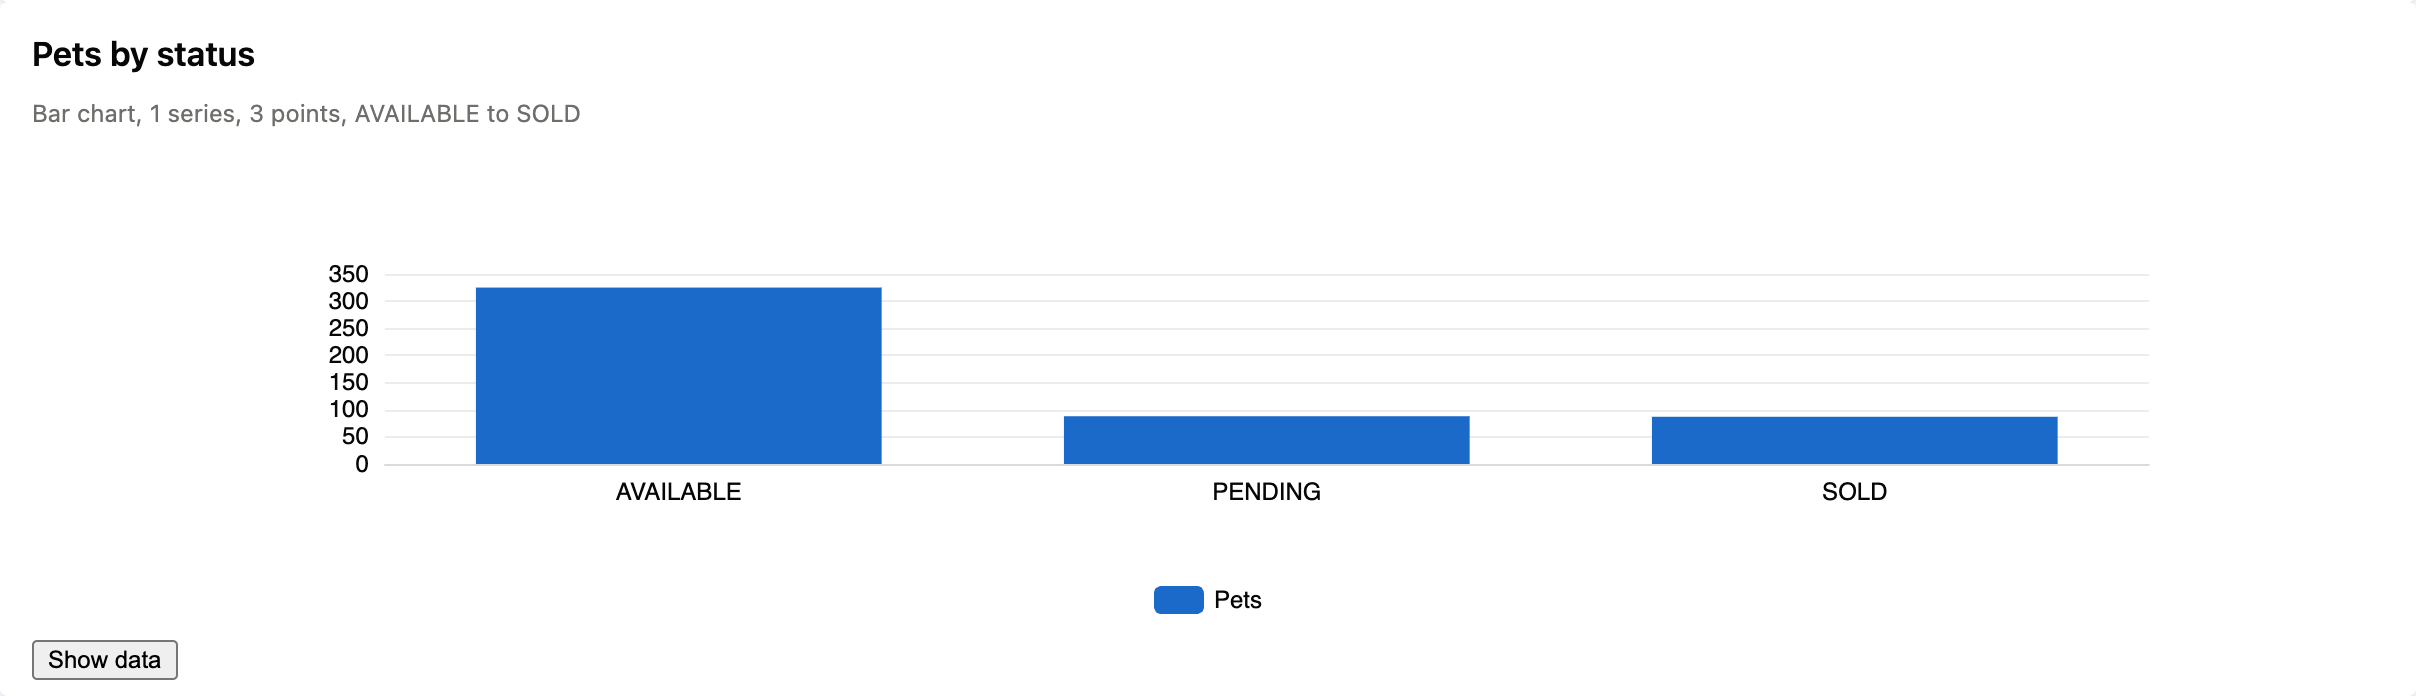
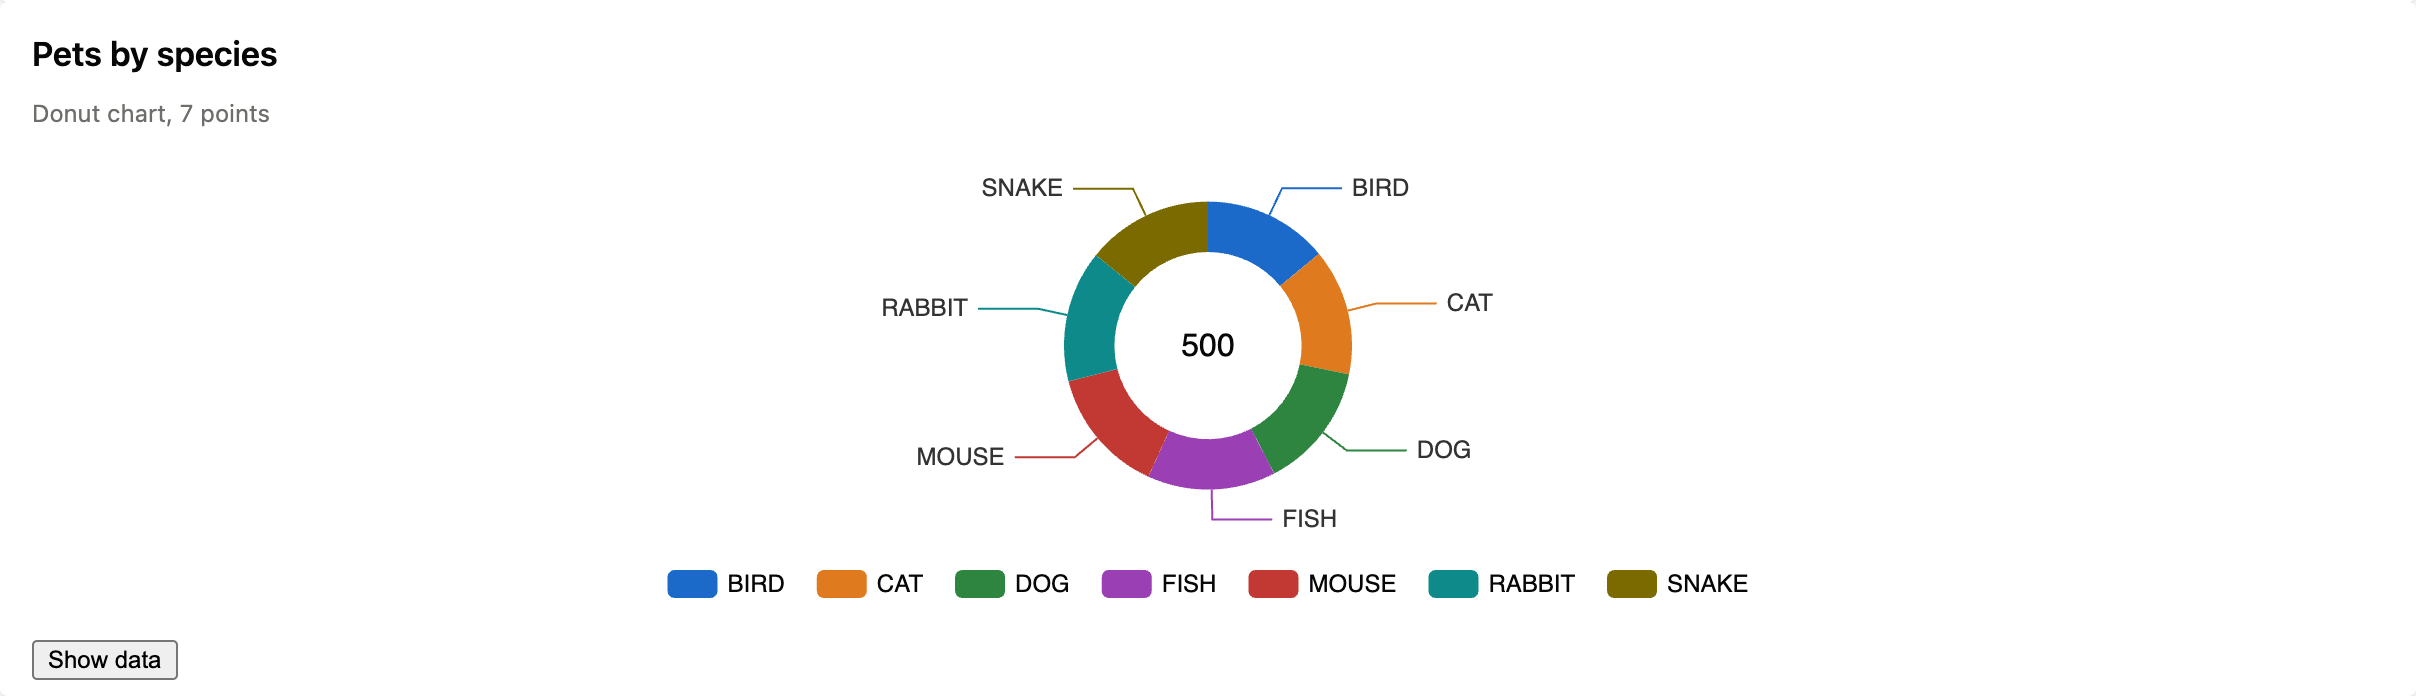
| Kind | Needs | Options |
|---|---|---|
line | x, one or more series | y, legend, height |
bar | x, one or more series | stacked, orientation: 'horizontal', y, legend, height |
donut | label, value | center ('total' or literal text) |
x is a field name, or { field, type, label } where type is category, time or number. A series is a
field name, or { field, label, tone }. A tone is danger, ok or warning, or a palette index from 1 to 8; colors come from
the --jc-chart-1 to --jc-chart-8 theme properties when a theme sets them.
A donut folds two or more slices under 2% into one "Other" slice.
Options
| Key | Meaning |
|---|---|
src= / data | Exactly one. data is an inline array of rows. |
refreshMs | Re-fetch src= every N ms, at least 5000; needs src= (inline data never refreshes). If a refresh fetch fails, the last chart stays, dimmed, and polling continues. |
height | Plot height in pixels, at least 120 (default 240). |
legend | bottom (default), right or none. |
emptyText | Shown when there are no rows (default "No data."). |
onClick.href | A same-origin path template (no scheme, no // prefix, no .. segment); {field} is replaced with the clicked row's URL-encoded value. A cross-origin href fails the page in Java (ChartDef and the card check); if one still reaches the browser, juneau-charts.js logs E-JS-79 and ignores the click. |
Clicking a point, bar or slice fires a juneau:chart-click event with detail = { card, row, series } (series is null for the built-in kinds), whether or not
onClick.href is set. (A donut's folded "Other" slice stands for several rows, so it doesn't click.)
Following a table filter
A chart can follow a table on the same page through the params subscription role. The chart's src= carries a
{token}, the subscription maps a field of the published payload to that token, and the chart re-fetches whenever
the payload changes. A datatables card publishes filter:<id> with the search box text in search, so this chart
follows the search box of the table changes:
<@card type="datatables" id="changes" title="Changes">
{ dataUrl: '/api/changes', columns: [ { key: 'id' }, { key: 'owner' } ] }
</@card>
<@card type="chart" id="byOwner" title="Open changes by owner" src="/api/changes/by-owner?q={q}"
       subscribes=[{"topic": "filter:changes", "as": "params", "map": {"q": "search"}}]>
{ kind: 'bar', x: 'owner', series: [ { field: 'open', label: 'Open' } ] }
</@card>
From Java, wire the card you get from toCardSpec(); ChartDef itself rejects subscribes because wiring is
card-level:
page.card(ChartDef.bar("byOwner").title("Open changes by owner").src("/api/changes/by-owner?q={q}")
	.x("owner").series("open", "Open")
	.toCardSpec()
	.subscribes(Subscription.to(Topics.filter("changes")).as("params").map("q", "search")));
Until the first payload arrives, the chart waits instead of fetching a URL with an unfilled {q}. params is the only
role a chart accepts: a chart does not publish, and any other as: value on a chart subscription fails the page
(E-44 in Java, E-JS-47 in the browser).
Accessibility
The chart is an SVG with role="img", or role="group" when the card is clickable (onClick.href is set, so the
marks inside it are interactive). Either way it is labelled through aria-labelledby by a caption that summarizes it, for example "Line chart, 2 series, 7 points, Day from 'Mon' to 'Sun'", so a screen reader
reads the summary once. The legend swatches are decorative, and the legend lists each series (or slice) by name. A
Show data button (it becomes Hide data, and reports aria-expanded) reveals the same rows as a table, which
is the accessible alternative to the drawing.
Keyboard focus applies only when onClick.href is set. Then each point (line and bar) or slice (donut) is a focusable
role="button" with a label such as "Mon: Placed 3, Delivered 1". On a line or bar chart the points form one tab
stop and the arrow keys move between them; on a donut each slice is its own tab stop and the arrow keys do nothing.
Enter or Space follows the link. Without onClick.href the marks are not focusable and not buttons; use the data
table instead.
If a refresh cannot redraw the chart (the renderer throws, or a series field has disappeared from the rows), the card shows the error once as an alert, polling stops, and the card fails. A refresh whose fetch fails keeps the last chart, dims it, and tries again on the next tick.
Your own kinds
JuneauCharts.register("spark", function (plot, rows, card, c) {
	const svg = c.svg(plot);
	// draw with c.node(svg, tag, cls, attrs), c.scaleLinear(...), c.tone(series, i)
	return { update(rows) { /* redraw */ }, destroy() { /* clean up */ } };
});
A script that loads before juneau-charts.js can queue its kinds instead:
(window.JuneauConsoleCharts = window.JuneauConsoleCharts || []).push(["spark", renderer]);.
A kind name is lowercase letters, digits and hyphens, starting with a letter, at most 32 characters
(^[a-z][a-z0-9-]{0,31}$); ChartDef and the card check reject any other name. A card whose kind isn't registered yet waits; if the kind still isn't there when the page has loaded, the card
shows E-JS-60.
Errors
| Code | When |
|---|---|
| E-JS-60 | The card's kind is not registered. |
| E-JS-62 | The src= fetch failed. On a refresh the error is only logged and the last chart stays, dimmed. |
| E-JS-63 | A series field is missing from the rows. |
| E-JS-64 | A kind was registered twice. |
| E-JS-75 | refreshMs was below 5000; the minimum is used. |
| E-JS-79 | onClick.href resolved to a URL that isn't same-origin. |
| E-JS-80 | A kind's renderer threw. It is shown once; a failed refresh also stops polling. |
Java checks the card body when the page renders: a missing or malformed kind, both or neither of src= and data,
a line or bar without x and a series, a series with no field, a donut without label and value, refreshMs below 5000 (or without src=), height below 120, and an onClick.href
that isn't a same-origin path all fail the page.